Laravel 13
Livewire
Redis
Stock Intelligence
Price Monitoring
Product Matching
Queue Automation
Private B2B Product Intelligence and Stock Monitoring Platform
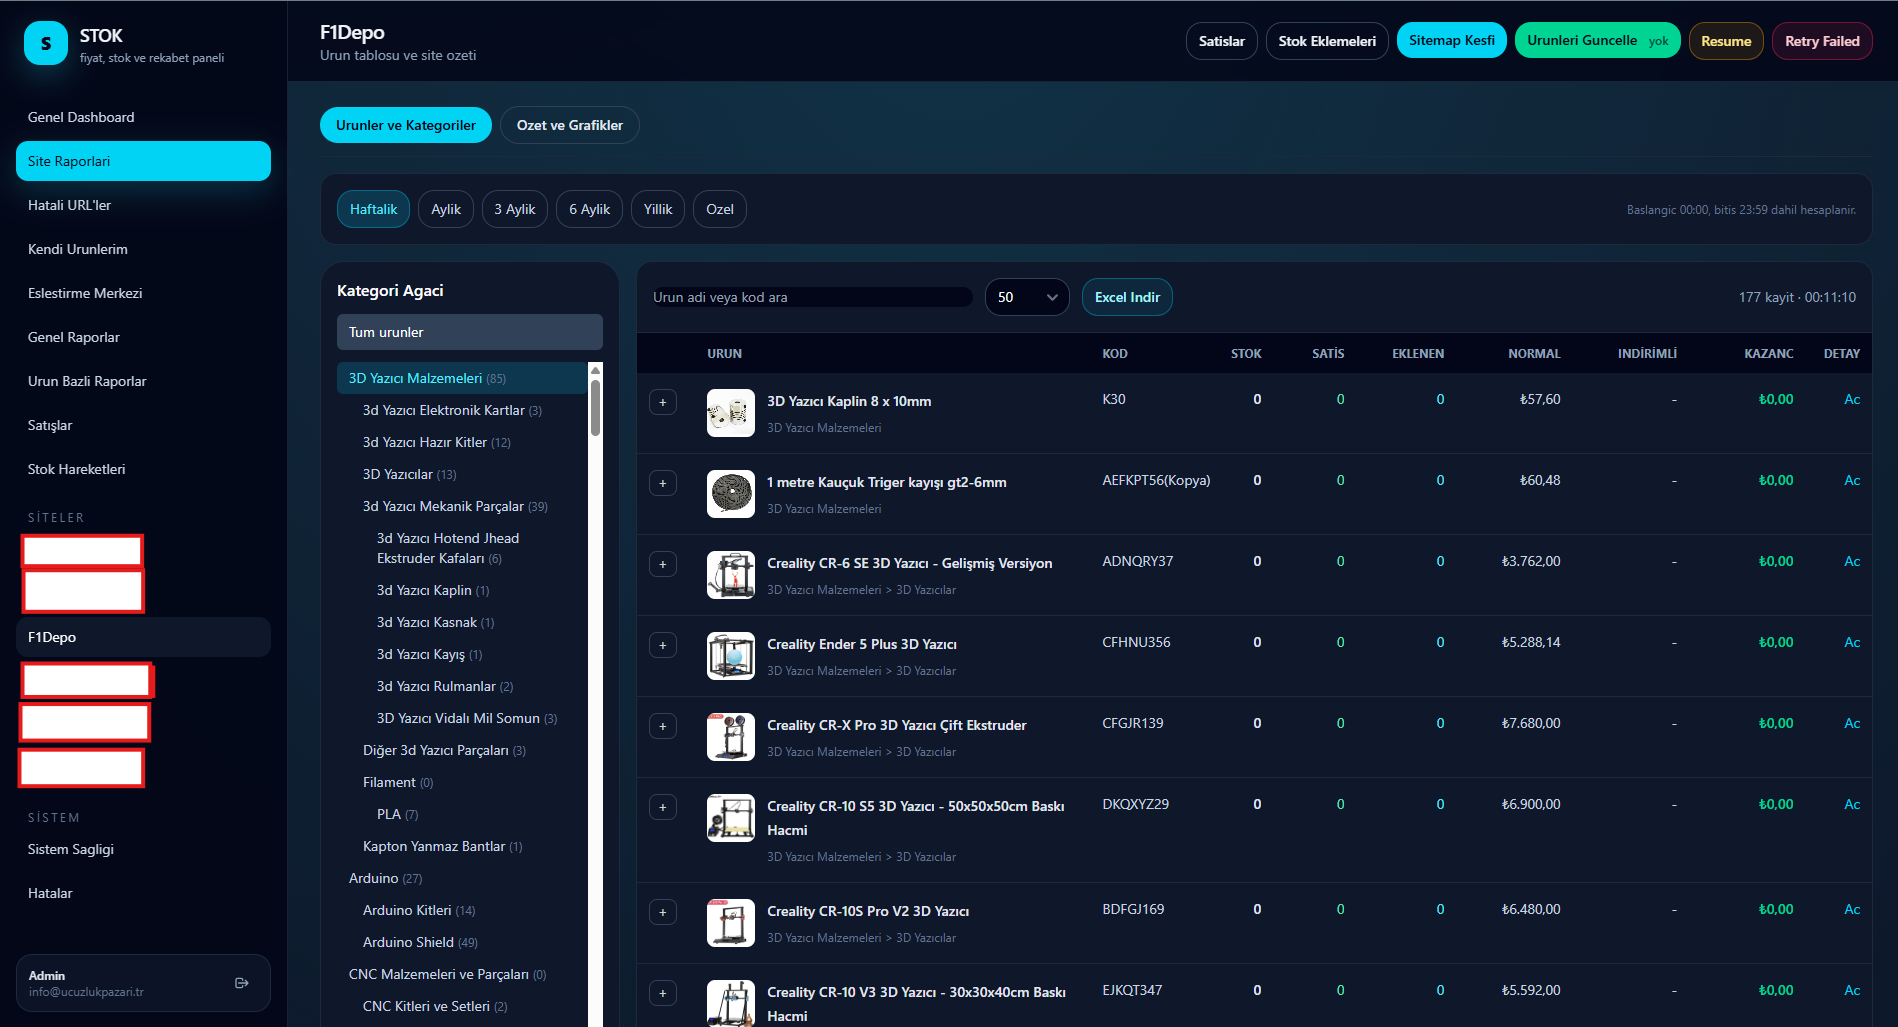
This project is a private B2B product intelligence application designed to consolidate
product availability, pricing and stock movement data from multiple external product
sources into a single operational interface.
The system goes beyond periodically collecting product information. It maintains a
normalized internal product catalog, discovers and updates external products,
records historical snapshots, detects stock and price changes, associates equivalent
products across different sources and turns those records into searchable reports
and decision-support views.
One of the core engineering challenges was converting independently structured product
data into a consistent model that could answer practical questions such as
where an item is available, how its price has moved, whether stock has increased
or decreased, how an internal price compares with external alternatives and which
records actually represent the same physical product.
The Operational Problem
When the same or comparable products appear across multiple data sources,
manually checking availability and pricing quickly becomes impractical.
Product names can differ, stock codes may follow different conventions,
categories may not align and prices can change independently throughout the day.
A simple spreadsheet provides only a temporary snapshot. It cannot reliably preserve
historical state, identify meaningful changes, recover interrupted updates or establish
durable relationships between equivalent products.
Fragmented Product Data
Product names, codes, prices, stock quantities and category structures arrive
in different formats and require normalization before they become comparable.
Continuously Changing Availability
Current stock alone is not enough. The system also needs to understand what
changed since the previous observation and preserve that history.
Product Identity Matching
The same item may be represented differently across sources, requiring
controlled matching rather than assuming identical names mean identical products.
Operational Reliability
Thousands of asynchronous update operations require queues, retries,
checkpoints and recovery logic rather than a single long-running request.
Internal Product Catalog as the Comparison Anchor
The application maintains an independent internal product catalog that acts as the
reference layer for product comparison. This separates the business's own product
identity from the constantly changing structures used by external sources.
Product catalogs can be imported from CSV or XLSX files.
During import, common column variations are normalized so product names,
codes, SKUs, categories, regular prices, discounted prices and stock quantities
can be inserted or updated without rebuilding the catalog manually.
Product Identity
Product codes, SKUs and normalized names provide stable identifiers
for matching and reporting.
Category Structure
Category names and hierarchical category paths allow large catalogs
to be filtered and compared by business-relevant groups.
Commercial Baseline
Internal price, discounted price and stock values become the baseline
against which matched external records can be evaluated.
Automated Product Discovery and Data Acquisition
External product information is collected through source-specific adapters.
Each adapter understands how to discover products and convert its source data into
the application's canonical product representation.
The rest of the application does not need to understand those individual source formats.
Once processed, products enter a shared data model containing normalized attributes such as
product identity, category, current stock, stock status, regular price,
discounted price, effective price, currency and discount information.
Discovery Runs
Periodic discovery identifies products that are not yet part of the monitored catalog.
Scheduled Updates
Existing records are refreshed automatically so price and stock data remain operationally useful.
Manual Product Processing
Individual product records can be added to the processing pipeline when an immediate check is required.
Source Isolation
Source-specific processing remains isolated so one integration does not dictate the behavior of another.
Historical Stock and Price Snapshots
Current values are useful for answering what is available now.
Historical snapshots are required to understand what changed.
The platform records a new snapshot when relevant product state changes,
including stock, stock status, price, discounted price, effective price,
discount percentage or currency. This creates a compact event history instead
of repeatedly storing identical observations.
| Tracked Signal |
Stored State |
Operational Use |
|
Stock
|
Previous and current quantities
|
Detect decreases, replenishment and availability changes
|
|
Stock status
|
Structured availability state
|
Distinguish confirmed quantities from unknown availability
|
|
Regular price
|
List price history
|
Identify commercial price movement
|
|
Discounted price
|
Active reduced price
|
Separate temporary commercial changes from standard pricing
|
|
Currency
|
Currency associated with the observed price
|
Prevent invalid comparisons between incompatible price values
|
Stock Movement and Estimated Sales Signals
Each new snapshot is compared with the previous observation.
This allows the application to derive additional operational signals from otherwise static product data.
Stock Change
Difference between the current and previous observed quantity.
Stock Increase
Positive inventory changes can be isolated as replenishment signals.
Estimated Sales
A decrease between two known stock observations can be treated as an estimated movement signal.
Estimated Value
Movement quantities can be evaluated against the effective observed product price.
These values are intentionally treated as derived intelligence rather than authoritative
transaction data. A stock decrease can indicate product movement, but the system does not
misrepresent an inferred quantity as a confirmed sales order.
Product Matching Across Independent Catalogs
Reliable comparison depends on identity resolution.
Comparing two similarly named items without confirming that they represent the same product
can produce misleading price and stock conclusions.
The matching layer therefore supports both assisted suggestions and explicitly confirmed relationships.
Internal products can be connected to corresponding external products, while equivalent
external products can also be grouped together across multiple data sources.
Exact Code Matching
Internal codes and SKUs are normalized before being compared with external stock codes,
providing a strong first-level matching signal.
Name Similarity Suggestions
When no exact code relationship exists, normalized product-name tokens are used
to generate similarity candidates for review.
Confirmed Relationships
Confirmed product mappings are persisted so the system does not need to rediscover
the same relationship every time a report is generated.
Cross-Source Match Groups
Equivalent products from several sources can be grouped into one comparison row,
making side-by-side availability and movement analysis possible.
Cross-Source Product Comparison Matrix
Once equivalent product records have been grouped, they can be represented as a single
logical product row with source-specific values displayed side by side.
This makes it possible to inspect stock, estimated movement and replenishment activity
without manually opening each individual product record.
| Logical Product |
Source A |
Source B |
Source C |
Aggregated Signal |
|
Confirmed product group
|
Stock / Price
|
Stock / Price
|
Stock / Price
|
Movement / Comparison
|
Price Position and Commercial Intelligence
Matched products are also used to evaluate the position of the internal catalog against
comparable external prices.
For compatible currencies, the reporting service calculates the lowest,
highest and average observed external price and compares those values with the
internal effective price.
Lowest Observed Price
Identifies the lower boundary of comparable matched pricing.
Highest Observed Price
Shows the upper range of observed pricing for the same matched item.
Average Price
Provides a reference point between available comparable prices.
Price Gap
Measures the difference between the internal effective price and the lowest matched price.
Product and Inventory Reporting
The reporting layer combines the internal product catalog with confirmed matches,
allowing the application to produce business-oriented summaries rather than exposing
raw collected records.
| Metric |
Meaning |
|
Product Count
|
Number of internal products within the selected filters
|
|
Stock Quantity
|
Aggregate internal stock quantity
|
|
Stock Value
|
Effective internal price multiplied by current stock
|
|
Potential Revenue
|
Current internal inventory evaluated at its effective price
|
|
Match Coverage
|
Number of external product relationships available for comparison
|
|
Price Position
|
Whether the internal price sits below, above or within the matched price range
|
Search, Filtering and Drill-Down Views
Large monitoring datasets become useful only when operators can move quickly from an
aggregate signal to the individual product records responsible for it.
Product Search
Search by product name, product code, SKU or external stock code.
Category Filters
Filter products using normalized hierarchical category relationships.
Match Status
Separate products with confirmed external relationships from records still requiring matching.
Historical Product View
Drill into individual products to review recent stock and price snapshots.
Time-Based Monitoring and Visual Analytics
Snapshot data is aggregated into time-series datasets for dashboard visualization.
The application can represent stock, pricing and estimated movement over selected periods
instead of limiting analysis to a single current value.
Stock Trends
Review inventory movement across a selected reporting period.
Price Trends
Follow observed price movement while retaining currency context.
Movement Signals
Aggregate estimated product movement from historical stock changes.
Source-Isolated Queue and Worker Architecture
A major part of this project is the background-processing architecture.
Product discovery and updates are not executed as one monolithic request.
Work is distributed through Redis-backed queues so independent data sources can
process jobs concurrently.
Each integration can have its own worker capacity and processing behavior.
A slow source therefore does not need to block every other active data pipeline.
Independent Queues
Source-specific workloads remain isolated from each other.
Configurable Concurrency
Worker capacity can be adjusted according to workload and system resources.
Background Scheduling
Recurring update, discovery, retry and maintenance jobs run without manual intervention.
Workload Isolation
A long-running operation in one integration does not create a global single-job bottleneck.
Failure Recovery and Resilient Background Processing
Long-running data pipelines eventually encounter network failures,
unavailable records, process interruptions or stale queue jobs.
The application therefore treats recovery as part of normal system behavior.
Duplicate Run Protection
Application-level locking prevents a second bulk run for the same data source
from starting while an active run is still in progress.
Stale Run Detection
A long-running job is not automatically considered failed.
Recovery is triggered when progress itself becomes stale.
Bounded Retries
Temporary network or processing failures can be retried according to a controlled policy
rather than being immediately discarded.
Resume Instead of Restart
Processing checkpoints allow interrupted workloads to continue from their existing
state instead of unnecessarily rebuilding an entire discovery run.
Runtime Health and Operational Visibility
Background automation is useful only when its health can be verified.
The application includes a dedicated system-health layer that provides visibility into
the infrastructure responsible for keeping the data pipelines running.
Redis Health
Confirm that the queue infrastructure required by background processing is reachable.
Worker Health
Detect missing or stale worker supervisor heartbeats.
Scheduler Health
Verify that recurring automation is still being triggered as expected.
Pipeline Health
Monitor pending, active, stale and failed processing records.
Excel Export and Operational Data Access
Although the application replaces repetitive spreadsheet-based monitoring,
spreadsheets remain useful as an interchange and analysis format.
Product views can therefore be exported to XLSX while the internal catalog itself
can be maintained through structured CSV/XLSX imports. This allows the application
to integrate into existing operational workflows without making Excel the primary database.
Private, Authentication-Protected Deployment
The application is designed as a private operational system rather than a public storefront.
Application screens require authentication, and there is no public self-registration workflow.
It can operate in a controlled local or private environment where background workers,
Redis and scheduled tasks start automatically, allowing non-technical users to interact
with the browser-based interface without manually managing command-line processes.
Reference Architecture
Layer 1
Data Acquisition
Source adapters, product discovery and scheduled refresh operations.
Layer 2
Processing
Redis queues, isolated workers, retries, locking and recovery.
Layer 3
Product Intelligence
Normalization, snapshots, matching, stock movement and price metrics.
Layer 4
Reporting
Comparison matrices, product reports, charts, filtering and exports.
Layer 5
Operations
Authentication, health monitoring, scheduling and maintenance.
Technical Scope
PHP 8.3+ & Laravel 13
Application services, domain models, scheduling, authentication and background workloads.
Livewire
Interactive server-driven application interfaces.
Redis & Dedicated Queues
Parallel asynchronous data processing and workload isolation.
TailwindCSS 4 & Flowbite 4
Responsive operational interface and reusable UI components.
Chart.js
Historical stock, price and movement visualization.
CSV / XLSX Integration
Internal catalog import and operational report export workflows.
Snapshot-Based History
Change-aware historical persistence for price and stock state.
Runtime Monitoring
Worker, scheduler, Redis, queue and stale-processing health visibility.
From Raw Product Records to Operational Intelligence
The most important part of this project is not data collection itself.
The engineering value comes from turning independently structured and continuously
changing product records into a stable operational model.
Product normalization creates a common language. Snapshot history makes change measurable.
Product matching makes cross-source comparison trustworthy. Queue isolation makes the acquisition
layer scalable. Recovery mechanisms keep the system useful when individual operations fail.
Reporting then converts those technical capabilities into information that can support
inventory, pricing and purchasing decisions.
This architecture is particularly relevant to B2B operations that need
supplier inventory visibility, product availability monitoring,
purchasing intelligence, price comparison, catalog normalization or automated stock tracking
across systems that do not provide one consistent data interface.