Laravel 13
Livewire 4
Multi-Tenant SaaS
Energy Analytics
Hourly Netting
PostgreSQL
Battery Simulation
API / MCP / AI
Multi-Tenant Solar Energy Netting and Optimization SaaS
Gesmahsup is a multi-tenant energy management SaaS I designed and developed
to turn raw solar production, electricity consumption and market-price data
into understandable operational and financial intelligence.
The core problem is straightforward to describe but technically difficult to solve:
knowing how much a solar plant generated does not tell the owner
how much that generation was actually worth.
Financial value depends on when electricity was generated, when it was consumed,
what portion was self-consumed, what became surplus, which pricing and netting rules applied,
whether annual limits were reached and whether the underlying hourly data was complete enough
to trust the calculation.
Gesmahsup therefore operates as more than a solar monitoring dashboard.
It combines hourly energy ingestion, rule-driven netting calculations,
tariff and market-price data, data-quality controls, financial analysis,
reports, operational alerts, battery what-if simulations and portfolio management
in one SaaS application.
The product was designed around a fundamental principle:
raw telemetry should remain separate from derived financial results.
Production, consumption and market data can be corrected or backfilled,
after which the system can deterministically recalculate the affected period
while preserving previous calculation versions for traceability.
The Problem: Production Data Alone Does Not Explain Solar Economics
Most solar monitoring systems are excellent at showing inverter output,
daily generation and equipment status. Those metrics are important,
but they answer only one part of the business question.
A business owner ultimately needs to understand the economic interaction between
production, consumption, grid imports, surplus energy, tariff values and market prices.
Two facilities with exactly the same monthly solar generation can produce very different
financial outcomes if their hourly consumption profiles are different.
When Was Energy Generated?
Monthly production totals hide the hourly relationship between generation and demand.
How Much Was Self-Consumed?
Solar electricity consumed directly can have a different economic value from surplus electricity.
What Happened to Surplus Production?
Surplus generation needs to be evaluated using the applicable rule set,
limits and hourly market or tariff context.
Can the Result Be Trusted?
Missing production, consumption or market-price hours can materially change a financial result.
What Could Be Improved?
Visibility becomes more valuable when the system can reveal
load-shifting or storage scenarios rather than only showing historical data.
How Do Multiple Facilities Compare?
EPC, O&M and multi-site organizations need portfolio-level visibility
without losing tenant and customer isolation.
Energy Data Architecture
The calculation engine depends on several independent time-series inputs.
Each source is ingested and stored independently before the netting layer
derives financial results from those observations.
| Data Domain |
Granularity |
Purpose |
|
Solar Production
|
Hourly
|
Measure electricity generated by each plant
|
|
Facility Consumption
|
Hourly
|
Determine when generated electricity overlaps with demand
|
|
Day-Ahead Market Price
|
Hourly
|
Provide market-price context for applicable surplus calculations
|
|
Electricity Tariff
|
Effective period
|
Value avoided grid consumption and other tariff-dependent calculations
|
|
Exchange Rates
|
Daily
|
Normalize foreign-currency investment scenarios such as battery CAPEX
|
|
Weather
|
Time series
|
Support contextual production and performance analysis
|
Multiple Data Sources, One Canonical Energy Model
One of the most important architectural decisions was preventing external providers
from defining the internal domain model.
Provider-specific APIs and file formats are converted into canonical hourly production
and consumption records before they reach the calculation engine.
Inverter / Plant APIs
Provider adapters normalize external production telemetry into hourly plant records.
Manual Production Import
Facilities without supported APIs can provide structured hourly production data.
Consumption Imports
Guided CSV, XLSX and ODS workflows transform metering exports into hourly consumption data.
Market Data
Day-ahead market prices are ingested through a dedicated integration layer and stored centrally.
Exchange Rates
Daily exchange-rate snapshots support investment and CAPEX calculations.
Weather Context
Weather observations can be stored alongside facility data for contextual analysis.
Provider-Agnostic Integration Architecture
External energy APIs are isolated behind provider-specific connectors and adapters.
The rest of the application works against stable internal interfaces rather than
becoming tightly coupled to one inverter manufacturer or market-data provider.
Source
Provider API / File
Adapter
Integration Layer
This same contract-first approach is part of my broader
API integration architecture
:
isolate providers, normalize data, make retries safe and keep downstream business logic independent
from vendor-specific response formats.
Data Quality Before Financial Calculation
A financial energy report can look mathematically precise while still being wrong
if several production or consumption hours are missing.
Gesmahsup therefore treats data quality as part of the domain rather than as a technical afterthought.
The ingestion layer tracks expected hours, observed hours, missing intervals,
provider errors and import failures. Persistent problems are stored as explicit
ingestion issues instead of disappearing into application logs.
Expected Hours
Determine how many hourly observations should exist for the requested period.
Missing Hours
Detect incomplete production, consumption or market-price series.
Import Audit
Retain file mapping, row counts, errors and imported date ranges.
Persistent Issues
Repeated provider or data problems are grouped by fingerprint for operational follow-up.
Versioned Hourly Netting Engine
The core of the application is a deterministic netting engine that evaluates
production and consumption at hourly resolution and converts those energy flows
into measurable financial outcomes.
Calculation rules are represented through versioned rule sets instead of being
permanently embedded in controller code. This allows historical calculations
to remain associated with the rules and tariff context under which they were produced.
| Hourly Metric |
Meaning |
|
Production
|
Energy generated during the hour
|
|
Consumption
|
Facility electricity demand during the same hour
|
|
Self-Consumption
|
Generation directly offsetting consumption
|
|
Surplus
|
Production remaining after hourly consumption is covered
|
|
Deficit
|
Consumption remaining after solar production is applied
|
|
Paid Surplus
|
Surplus eligible for financial value under the active rule set
|
|
Over-Cap Energy
|
Production separated when the applicable annual limit is exceeded
|
|
Effective Value
|
Financial value associated with the calculated hourly energy flow
|
Why Calculation Versioning Matters
Energy data frequently arrives late or requires correction.
Replacing yesterday's number in place would make it impossible to explain
why a previously generated financial report changed.
Gesmahsup therefore treats netting results as versioned derived data.
When underlying inputs change, the affected period can be recalculated
into a new version while the previous version remains traceable.
Input Fingerprinting
The calculation captures a fingerprint of its inputs.
Re-running an unchanged period returns the existing active calculation
instead of creating duplicate versions.
Superseded Versions
When inputs genuinely change, the old calculation can be marked revised
and linked to its replacement.
Provisional Periods
Missing critical hourly data prevents incomplete monetary results
from silently being treated as final.
Tariff Snapshots
Relevant pricing context is preserved with calculated results
instead of assuming today's tariff explains a historical period.
Financial Precision Without Floating-Point Money Calculations
Energy platforms frequently combine very small unit prices with large monthly energy volumes.
Small rounding mistakes can accumulate into visible financial differences.
Monetary calculations are therefore handled using decimal and money value objects
rather than native floating-point arithmetic.
Monetary values are persisted using deterministic minor-unit representations,
while unit-energy prices retain sufficient decimal precision for repeatable calculations.
Annual Production Limit Tracking
Some calculation scenarios require more context than the current month.
The system maintains annual trackers so the engine can understand cumulative
production-related limits while calculating individual hourly and monthly periods.
Annual Context
Cumulative Production
Paid Capacity
Eligible Production Usage
Risk Visibility
Threshold Notifications
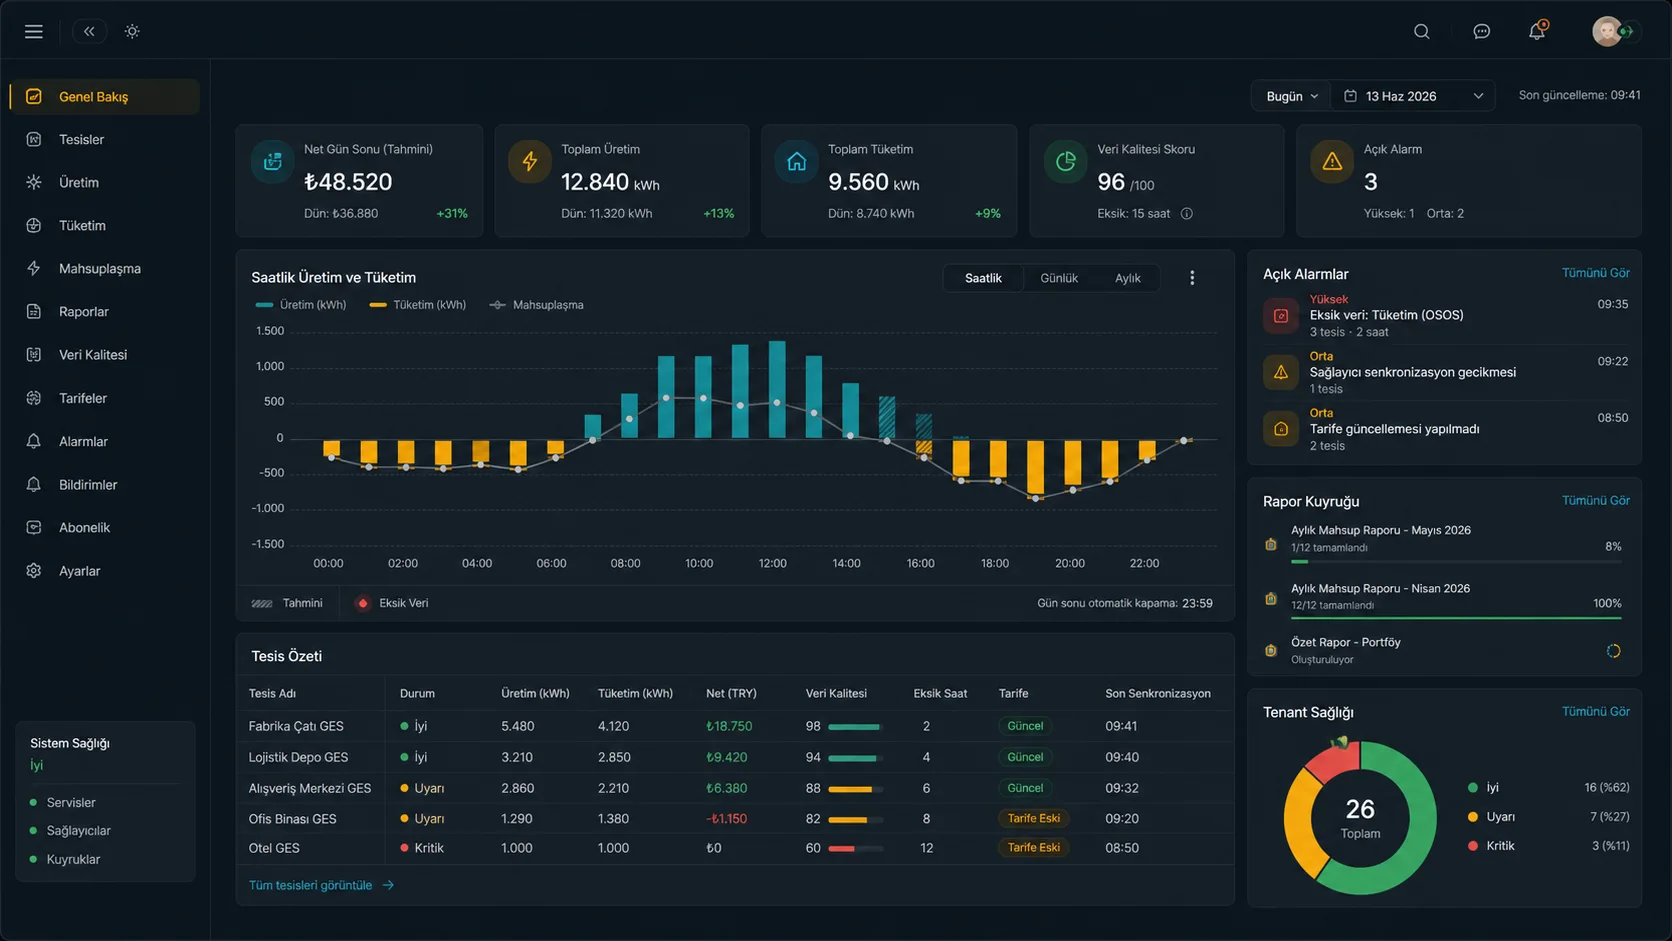
Energy Dashboard Built Around Financial Outcomes
The tenant dashboard is designed to answer business questions quickly
rather than forcing users to interpret raw inverter telemetry.
Energy
Production vs Consumption
Utilization
Self-Consumption
Financial
Net Energy Value
Detailed period screens can then expose the underlying hourly records,
market price, tariff value and data-quality state for users who need to validate
how the monthly result was produced.
Monthly Reporting and Verifiable PDF Archives
Business owners do not necessarily want to open an energy dashboard every day.
For many users, the most useful deliverable is a concise monthly report explaining
energy and financial performance.
Gesmahsup generates tenant-scoped monthly reports asynchronously,
keeping a persistent archive record linked to the calculation used to build each report.
PDF Reporting
- Monthly netting summary
- Energy and TRY metrics
- Data-quality context
- Calculation-period reference
- Tenant-aware branding
- Public verification identifier
- QR-based verification link
Spreadsheet Exports
- Hourly raw energy series
- Hourly netting detail
- Period summaries
- Portfolio summaries
- CSV exports
- XLSX exports
- ODS exports
Asynchronous Reporting Pipeline
Operational Alerts Instead of Passive Dashboards
A monitoring system should not require someone to continuously watch charts.
Gesmahsup includes an alert engine that evaluates operational conditions
and creates actionable events when attention is required.
Production Drop
Identify sustained production below an expected reference level.
Plant Offline
Detect an unexpected absence of provider data.
Annual Cap Warning
Notify users as configured annual production thresholds are approached.
Data Gap
Surface stale or missing consumption and production data before reporting.
Report Ready
Notify users when asynchronous report generation completes.
Alert Lifecycle
Track operational events through open, acknowledged and resolved states.
Multi-Channel Notification Workflow
Alerts can be routed according to the configured channel and user context.
Delivery attempts are recorded rather than assuming that creating an alert means
the responsible user actually received it.
Battery Storage What-If Simulator
One of the most valuable questions after understanding hourly energy economics is:
what would happen if surplus solar generation could be stored and used later?
Gesmahsup includes a battery simulation layer that operates on the same hourly production
and consumption history used by the netting engine.
Instead of estimating savings from monthly averages, it builds a battery-adjusted hourly series
and recalculates the financial result.
Battery Scenario Outputs
Capacity & Power
Scenario-specific storage and charge/discharge limits.
Financial Uplift
Difference between baseline and battery-adjusted net value.
Simple Payback
Investment snapshot evaluated against modeled annual uplift.
10-Year Cash Flow
Long-term scenario including configured degradation assumptions.
Simulation runs are processed asynchronously and can produce a dedicated feasibility PDF,
keeping heavier calculations outside the normal HTTP request lifecycle.
Multi-Tenant SaaS Architecture
Gesmahsup is designed as a SaaS product rather than a single-company energy dashboard.
Organizations operate inside isolated tenant contexts while shared market and reference data
can remain centralized where appropriate.
This separation is important because energy records, facilities, provider credentials,
reports, alerts and financial calculations are commercially sensitive.
Tenant isolation is therefore applied at the application and persistence layers,
not only by hiding navigation items.
Tenant-Owned Data
- Facilities and solar plants
- Provider credentials
- Production and consumption measurements
- Netting calculations
- Reports and exports
- Alerts and notification history
- Battery scenarios
- Tenant settings and branding
Shared Reference Data
- Market-level hourly energy prices
- Exchange-rate reference data
- Commercial plan catalog
- Rule-set definitions where centrally governed
SaaS Resource Hierarchy
→
→
→
→
Integration
Device / Provider
SaaS Plans, Feature Gating and Subscription Lifecycle
Subscription logic is part of the application domain rather than a cosmetic pricing table.
Plans define limits and capabilities that the application can enforce during normal tenant operations.
Facility Limits
Plans can define how many facilities an organization may actively manage.
Feature Flags
API access, exports, battery simulation, alerts and white-label functionality
can be enabled according to commercial plan.
Trial & Active States
Subscription lifecycle controls whether tenant access remains available.
Add-Ons
Optional capabilities can be attached independently from the base plan.
Manual Billing
The current commercial workflow supports bank-transfer payment requests and manual reconciliation.
Billing Audit Trail
Invoices, payments, reminders and lifecycle events remain traceable.
EPC and O&M White-Label Portfolio Layer
The SaaS architecture also supports a partner model in which energy-service organizations
can manage multiple customer facilities through one portfolio while retaining customer-level access boundaries.
This turns the product from a single-facility analytics tool into a platform
that can support recurring post-installation energy services.
Customer Groups
Organize multiple facilities by customer portfolio.
Portfolio Dashboard
Compare facility status, data quality, net value, alerts and report readiness.
White-Label Branding
Apply tenant branding to the application, reports and selected notifications.
Custom Domains
Verified tenant domains provide a branded SaaS access point.
Scoped Support Access
Support users can be restricted to assigned customer portfolios.
Bulk Reporting
Portfolio-level workflows can queue reports for multiple facilities.
Role-Based Security and Tenant Isolation
Energy production, consumption and financial performance are sensitive operational information.
Access control is therefore applied according to tenant, team, role and assigned portfolio.
Tenant Isolation
Tenant-owned records remain scoped to the active organization.
RBAC
Roles and permissions govern access to administrative and operational capabilities.
Customer-Group Scope
Portfolio users can be prevented from accessing facilities outside assigned groups.
Audit Logging
Sensitive product and administrative events retain activity history.
API-First Energy Platform
The application exposes controlled API surfaces rather than treating the web interface
as the only way to access energy information.
API authentication, scopes, rate limits and OpenAPI documentation provide a foundation
for external applications, integrations and future mobile clients without bypassing
the SaaS permission model.
Explicit API Contracts
API endpoints are documented with structured request,
response and error contracts.
OAuth / Token Scopes
Token capabilities can be restricted instead of granting unrestricted application access.
Model Context Protocol for Energy Intelligence
Gesmahsup also includes a tenant-scoped
Model Context Protocol (MCP) layer.
Instead of giving AI systems direct database access, selected energy capabilities
are exposed as explicit application tools.
List Facilities
Discover facilities available to the authenticated tenant context.
Plant Status
Read plant and production-provider status.
Netting Summary
Retrieve the active monthly calculation summary.
Hourly Series
Read calculated hourly energy results.
Cap Status
Retrieve cumulative annual limit context.
Alerts
Query recent operational alerts.
Explain Month
Produce a structured monthly dataset suitable for grounded AI narration.
Simulate Battery
Start and poll a controlled battery simulation through the existing simulation engine.
MCP requests remain authenticated, scoped and rate-limited.
Successful tool calls are auditable so introducing an AI interface does not bypass
the application's existing tenant and permission boundaries.
AI-Assisted Energy Explanations
The intelligence layer is designed to explain already-calculated energy data
rather than letting a language model invent or recompute financial figures.
Structured monthly metrics can be transformed into narrative summaries,
while numeric guards and deterministic fallbacks keep the underlying calculation
engine as the authoritative source.
Monthly Narrative
Explain key monthly production, consumption and economic metrics in natural language.
Alert Explanation
Add context to production-drop or data-gap alerts using grounded application data.
Ask Your Facility
Provide a tenant-scoped conversational surface for interrogating available energy context.
Queue-Oriented Background Processing
Imports, provider synchronization, recalculations, PDF generation,
exports, simulations and alert evaluation can all be computationally expensive
or depend on slow external services.
These operations are moved outside normal page requests and processed through
dedicated background jobs so the SaaS interface remains responsive.
Energy Ingestion Jobs
Netting Recalculation Jobs
Report Generation Jobs
Spreadsheet Export Jobs
Alert Evaluation Jobs
Battery Simulation Jobs
Operational Observability and Support Tooling
Reliable SaaS operations require visibility into more than application exceptions.
The administration layer includes health and support surfaces for monitoring
queues, scheduled work, data synchronization and tenant-specific problems.
Queue Health
Monitor asynchronous workload depth and failures.
Scheduler Heartbeat
Detect whether recurring automation is still executing.
Data Gap Diagnostics
Inspect missing energy data and recent synchronization status.
Operational Recovery
Support controlled import retries and report regeneration without direct database edits.
Technical Scope
PHP 8.5 + Laravel 13
Domain services, SaaS workflows, APIs, integrations and background jobs.
Livewire 4
Reactive tenant, admin, dashboard and workflow interfaces.
PostgreSQL
Tenant-aware relational storage and indexed energy time-series records.
TailwindCSS 4 + Flowbite 4
Responsive SaaS, ERP-style and public product interfaces.
Saloon
Structured external API connectors and request classes.
Brick Money + BigDecimal
Deterministic money and energy-price calculations without native floats.
OpenSpout
Streaming CSV, XLSX and ODS import/export workflows.
Laravel Passport
Scoped API and MCP authentication.
Laravel Reverb + Echo
Real-time completion and application update events.
DomPDF + QR Code
Monthly financial reports and battery feasibility documents.
Laravel MCP + Laravel AI
Structured tenant-scoped AI and agent integration capabilities.
Pest + Larastan
Automated behavior, isolation and static-analysis quality controls.
What Makes This More Than an Energy Dashboard
The complexity of Gesmahsup is not the number of charts on the screen.
The difficult engineering work happens between the raw energy reading and the financial result.
1
Normalize multiple data sources
without allowing one provider to control the application architecture.
2
Validate hourly data quality
before turning incomplete measurements into monetary values.
3
Apply versioned business rules
to production, consumption, tariff and market-price data.
4
Preserve calculation history
when source data changes or arrives late.
5
Convert results into operational outputs
through dashboards, reports, alerts, exports and simulations.
6
Deliver all of this through a tenant-aware SaaS model
with subscriptions, plans, permissions, partner portfolios and white-label capabilities.
From Solar Monitoring to Energy Decision Support
Gesmahsup demonstrates how a specialized domain can be transformed into a scalable SaaS product.
Production telemetry is only the starting point.
The application combines telemetry, consumption data, energy-market information,
rule-driven financial calculations and business workflows into one operational platform.
For facility owners, the value is understanding what their solar investment is actually doing economically.
For energy teams, the value is hourly visibility, data-quality control and operational alerts.
For EPC and O&M organizations, the same architecture becomes a multi-customer portfolio product
with branded reporting and customer-scoped management.
From a software engineering perspective, the project brings together
multi-tenancy, time-series processing, financial calculation engines,
external API integrations, asynchronous jobs, reporting, billing, RBAC,
real-time events, simulation and AI-compatible interfaces
inside one domain-driven Laravel application.
Product Evolution
The application has been designed so advanced energy intelligence can be added
without replacing the existing ingestion and calculation foundation.
Current product development extends that foundation toward deeper forecasting,
storage optimization and portfolio intelligence.
Intelligence
Forecasting & Opportunity Detection
Storage
Advanced Battery Optimization
Platform
Portfolio & BESS Integration
These areas represent the product roadmap and should be distinguished from the currently implemented
production, consumption, netting, reporting, alert, SaaS and V1 battery-simulation foundation.
Calculation scope:
Energy-market and netting rules can depend on facility-specific regulatory,
contractual and metering circumstances. Gesmahsup is designed around versioned rule sets
and traceable source data so calculation behavior can be configured and reviewed.
The software does not replace legal, regulatory, accounting or investment advice.